
USDC Chart: How to Read USD Coin Price, Trends & Key Levels
USDC Chart: How to Read USD Coin Price, Trends & Key Levels
A USDC chart looks almost boring at first glance: a mostly flat line hovering near $1.00. That flatness is the point. USD Coin is a stablecoin designed to track the U.S. dollar 1:1, so its chart behaves very differently from Bitcoin or Ethereum. But "flat" does not mean "no information." The USDC chart still reveals liquidity stress, redemption pressure, market sentiment, and rare but important depeg events that matter to traders, treasurers, and businesses that hold or spend stablecoins.
This guide explains what a USDC chart actually shows, how to interpret price wicks and volume spikes, which levels matter, and how the chart connects to real-world use cases such as corporate stablecoin spending.
What Is USDC and Why Its Chart Looks Different
USDC Chart: How to Read USD Coin Price, Trends & Key Levels - What Is USDC and Why Its Chart Looks Different.
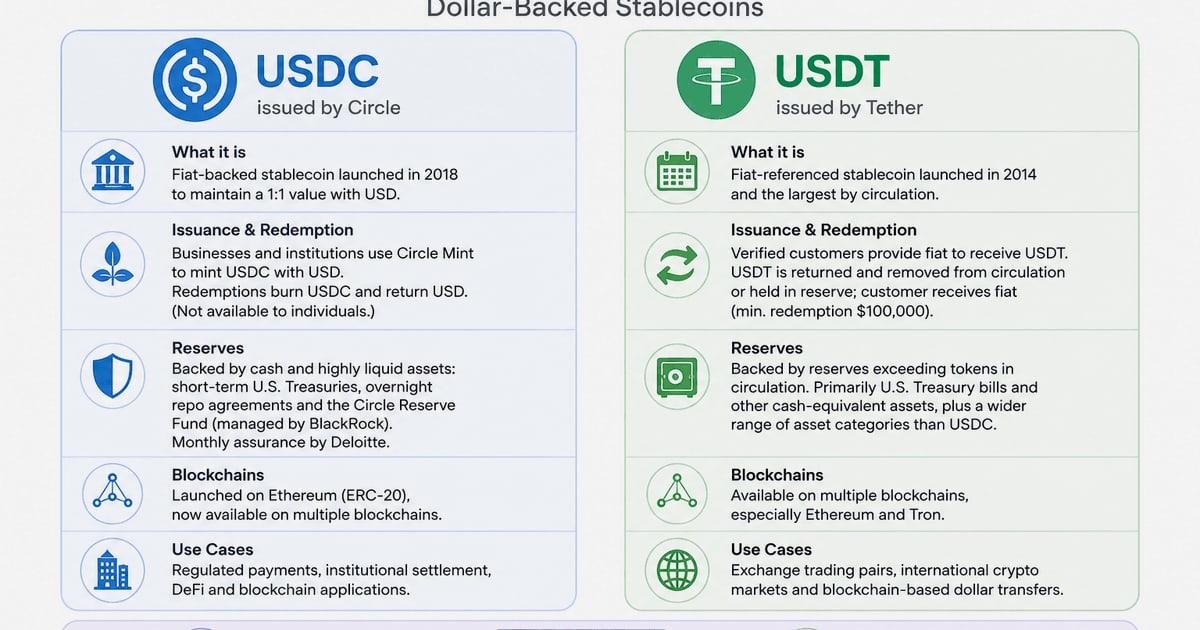
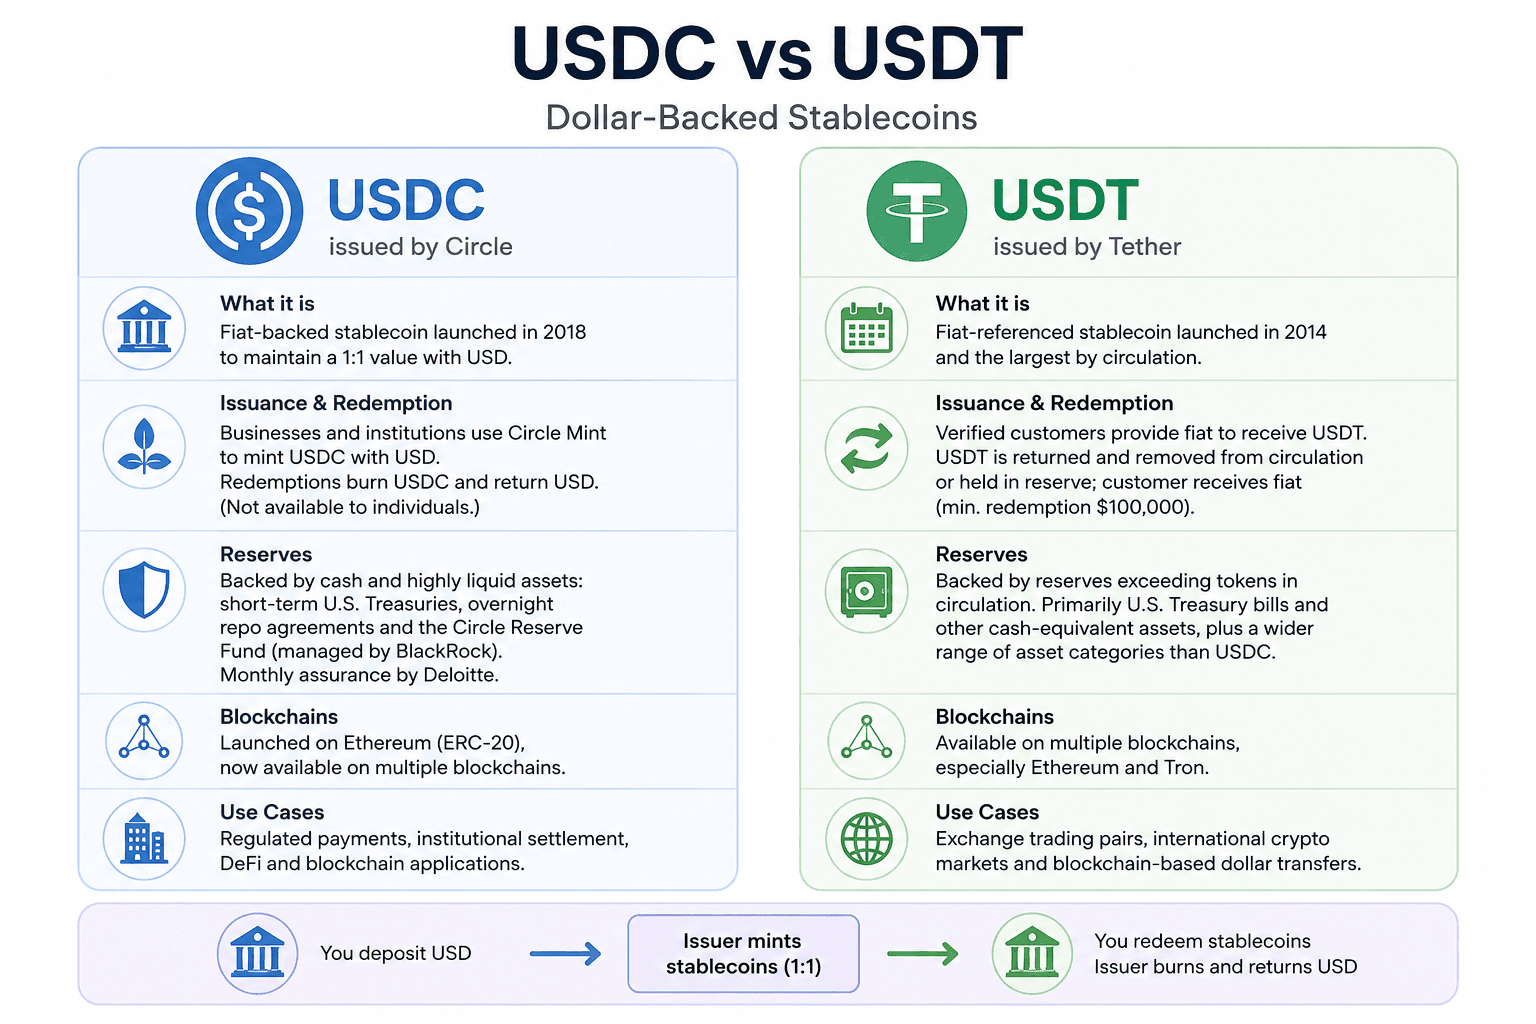
USDC is a fiat-backed stablecoin issued by Circle. Each token is intended to be redeemable for one U.S. dollar, backed by cash and short-term U.S. Treasury securities. Because of that redemption mechanism, the market price should stay close to $1.00 under normal conditions.
That makes the USDC chart fundamentally different from a volatile crypto chart. A 1% move on Bitcoin is noise. A 1% move on USDC is a major event. When the chart deviates from $1.00, it usually signals one of three things:
- Liquidity imbalance: A sudden surge in sell orders on one exchange without enough buyers.
- Redemption or custody concerns: Market doubt about the quality or availability of reserves.
- Technical or network issues: Withdrawals paused, bridge problems, or smart contract disruptions.
For most of its history, USDC has traded within a few basis points of $1.00. The exceptions are rare but instructive.
Key USDC Chart Metrics to Watch
Price and Daily Range
On a normal day, USDC trades between roughly $0.9995 and $1.0005. The daily range is tiny. If the range widens to $0.99 or $1.01, something unusual is happening. Watching the daily range is often more useful than watching the closing price because a stablecoin can close near $1.00 while experiencing sharp intraday stress.
Trading Volume
USDC regularly sees billions of dollars in 24-hour trading volume across major exchanges. Volume spikes can indicate:
- Large redemptions or minting activity
- Exchange-specific arbitrage between USDC and other stablecoins
- Flight-to-safety flows during broader crypto sell-offs
High volume with a stable price is healthy. High volume with a falling price is a warning sign.
Market Cap and Circulating Supply
The market cap of USDC has fluctuated between roughly $25 billion and $55 billion in recent years, depending on the broader stablecoin cycle. When market cap rises, it generally means more dollars are flowing into the crypto ecosystem through USDC. When it falls, capital is leaving or rotating into other stablecoins or fiat.
Tracking market cap alongside price helps distinguish between organic demand and temporary price distortion.
Support and Resistance Levels
For a stablecoin, the most important level is $1.00. Think of it as both support and resistance:
- Above $1.00: USDC can trade at a small premium when demand for a regulated, redeemable dollar token spikes. Premiums above $1.01 are uncommon and usually short-lived.
- Below $1.00: Discounts below $0.99 suggest redemption friction or panic. The March 2023 depeg is the clearest example.
Traders often watch the $0.995, $0.99, and $0.95 levels during stress events. The faster the price recovers to $1.00, the stronger the market's confidence in the peg.
USDC Price History: The Flat Line and the Exceptions
USDC Chart: How to Read USD Coin Price, Trends & Key Levels - USDC Price History: The Flat Line and the Exceptions.
Normal Conditions: 2018 to Early 2023
From its launch in September 2018 through early 2023, USDC traded in an extremely narrow band around $1.00. Brief deviations of a fraction of a cent occurred during volatile market days, but the chart was essentially a straight line punctuated by tiny wicks.
The March 2023 Depeg
The most important event on the USDC chart happened in March 2023. After Silicon Valley Bank collapsed, Circle disclosed that a portion of USDC's cash reserves was held at SVB. Within hours, USDC fell to roughly $0.87 on some exchanges.
The chart during that period showed:
- A sharp vertical drop from $1.00 to $0.87
- Extremely high volume as holders rushed to exit
- A gradual recovery over several days once federal regulators guaranteed SVB depositors
- A return to $1.00 by mid-March
That event is now the reference point for stablecoin risk analysis. It demonstrated that even a well-regarded stablecoin can depeg when reserve custody is questioned, and it showed how quickly the market can restore confidence when the underlying issue is resolved.
All-Time Highs and Lows
USDC's all-time high is often cited around $2.35, but that figure is misleading. It reflects an early, illiquid trading period or a data artifact, not a genuine market premium. The all-time low around $0.877 is the March 2023 depeg low and is the more meaningful number for risk assessment.
For practical purposes, the USDC chart has spent almost its entire life between $0.99 and $1.01.
How to Read a USDC Chart on TradingView or CoinMarketCap
USDC Chart: How to Read USD Coin Price, Trends & Key Levels - How to Read a USDC Chart on TradingView or CoinMarketCap.
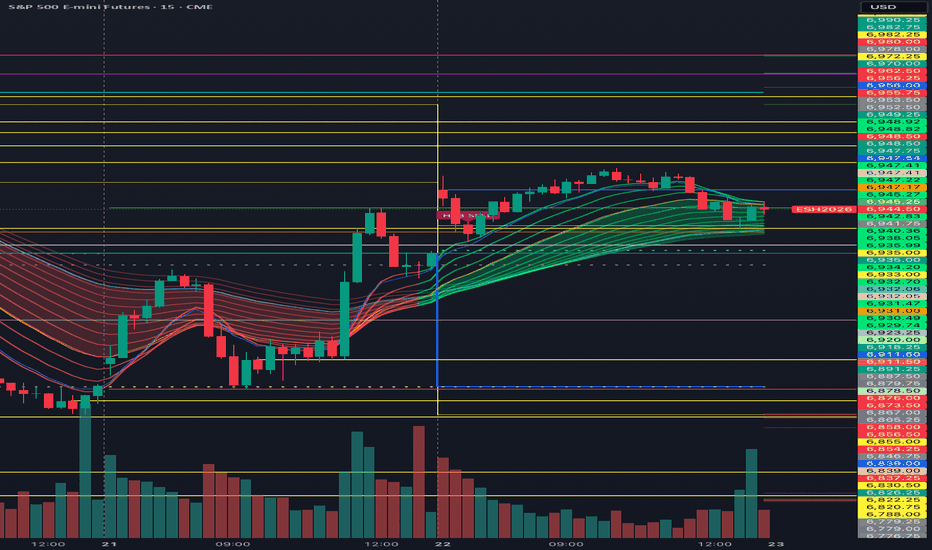
Most charting platforms offer similar tools for USDC. Here is a practical workflow:
- Set the timeframe to 1D or 1W. Intraday timeframes are too noisy for a stablecoin. The daily chart captures depeg events clearly.
- Add a horizontal line at $1.00. This is your baseline. Distance from this line is the story.
- Check the volume pane. Look for volume spikes that coincide with price deviations. Volume confirms whether a move is meaningful.
- Compare USDC/USDT and USDC/USD pairs. Differences between pairs can reveal exchange-specific stress or arbitrage opportunities.
- Watch the market cap chart. Price may look stable while supply is changing rapidly. Supply changes signal capital flows.
For deeper analysis, TradingView's USDC chart offers technical indicators, while CoinMarketCap's USDC page provides market cap, volume, and exchange pair data. Yahoo Finance's USDC quote is useful for a traditional finance view of the same data.
What Moves the USDC Chart
Reserve Composition and Transparency
USDC's price stability depends on confidence in its reserves. Circle publishes monthly attestations showing the mix of cash and Treasury holdings. Any negative news about reserve custody or composition can move the chart quickly, as March 2023 showed.
Regulatory Actions
Stablecoin regulation in the U.S., EU, and other jurisdictions affects USDC demand. Positive regulatory clarity tends to support the peg and increase market cap. Enforcement actions against other stablecoins can also drive flows into USDC as a perceived safer alternative.
Broader Crypto Market Stress
During major sell-offs, traders often rotate from volatile assets into stablecoins. USDC typically benefits from this flight to safety, which can push its market cap higher even as the broader market falls.
DeFi and Exchange Integration
USDC is deeply integrated into DeFi protocols, exchanges, and payment rails. Changes in integration—such as a major exchange delisting USDC or a new chain deployment—can affect demand and, in extreme cases, short-term price.
USDC Chart vs. Other Stablecoin Charts
Comparing USDC to USDT, DAI, and other stablecoins can reveal relative market sentiment.
| Stablecoin | Peg Mechanism | Typical Chart Behavior | Key Risk |
|---|---|---|---|
| USDC | Fiat-backed, cash and Treasuries | Very tight around $1.00 | Reserve custody events |
| USDT | Fiat-backed, broader asset mix | Slightly wider deviations | Reserve composition opacity |
| DAI | Crypto-collateralized | More volatile, wider band | Collateral liquidation cascades |
| FRAX | Algorithmic and collateral mix | Moderate volatility | Algorithm failure risk |
USDC generally shows the tightest peg among major fiat-backed stablecoins during normal conditions, though USDT has also maintained a strong peg despite recurring questions about its reserves.
Using the USDC Chart for Business Decisions
For businesses that hold or spend USDC, the chart is a risk-monitoring tool rather than a trading signal.
Treasury Management
A corporate treasury holding USDC should monitor:
- Daily price deviation from $1.00
- Market cap trends
- News about Circle's banking partners and reserve attestations
A stable chart with rising market cap suggests healthy demand. A sudden price drop with high volume warrants immediate review of redemption options.
Operational Spending
Companies that use USDC for payroll, vendor payments, or subscriptions care less about intraday wicks and more about reliable conversion to fiat. The key question is whether USDC can be spent or converted at close to $1.00 when needed.
Platforms like Cardfornia enable businesses to fund a corporate account with USDC and issue multi-currency virtual cards for everyday expenses. That turns the stablecoin chart from a speculative object into an operational tool: the peg matters because it determines whether a $1,000 SaaS invoice costs $1,000 or $1,003 when settled.
For teams evaluating stablecoin spending infrastructure, the compliant crypto payment cards guide explains what regulatory safeguards to look for, and the Cardfornia pricing breakdown shows how fees and limits work in practice.
Common Mistakes When Reading the USDC Chart
Mistaking Data Artifacts for Real Moves
Early USDC price data includes extreme values that reflect thin liquidity, not genuine market pricing. The $2.35 "all-time high" is a prime example. Always check volume before drawing conclusions from an outlier.
Ignoring Exchange-Specific Prices
USDC can trade at different prices on different exchanges during stress events. A depeg on one low-liquidity exchange may not reflect the broader market. Check multiple sources before acting.
Overreacting to Tiny Deviations
A move from $1.0000 to $0.9997 is not a depeg. It is normal market noise. Stablecoins trade within a small band because arbitrageurs profit from any meaningful deviation.
Confusing Market Cap with Price
A falling market cap does not mean USDC is losing its peg. It often means redemptions are happening at $1.00, which is exactly how the system is supposed to work.
Related reading
- Cardfornia vs Banqa vs OneSafe: Which Fits Your Business? - Compare Cardfornia, Banqa, and OneSafe for crypto business spending. See custody models, card features, pricing signals, and which platform fits your team.
- ConnexPay Review 2026: Unified B2B Payments Platform - Evidence-based ConnexPay review covering the unified PayIn/PayOut model, use cases, pricing signals, setup, and who should actually use it in 2026.
FAQ
Why does the USDC chart look like a flat line?
USDC is designed to maintain a 1:1 peg with the U.S. dollar. Arbitrage and redemption mechanisms keep the price within a few basis points of $1.00 during normal conditions, so the chart appears nearly flat compared to volatile cryptocurrencies.
What happened to USDC in March 2023?
USDC briefly fell to about $0.87 after Circle disclosed that some cash reserves were held at Silicon Valley Bank, which had just collapsed. The price recovered to $1.00 within days after regulators guaranteed SVB depositors.
Is a USDC price below $1.00 a buying opportunity?
It can be, but only if you believe the peg will be restored. During the March 2023 depeg, buying below $0.90 was profitable for those who correctly assessed that the banking issue would be resolved. However, stablecoin depegs can also signal deeper solvency problems, so the risk is not zero.
How can I check USDC's market cap and supply?
CoinMarketCap, CoinGecko, and Yahoo Finance all display USDC market cap, circulating supply, and total supply. Circle also publishes monthly reserve attestations on its website.
Can businesses use USDC for everyday spending?
Yes. Platforms like Cardfornia let businesses fund an account with USDC and issue virtual cards for subscriptions, advertising, SaaS, and travel. The stablecoin's peg means spending power stays predictable in dollar terms.
What is the most important level on the USDC chart?
$1.00 is the anchor. Sustained trading below $0.99 or above $1.01 signals unusual market conditions and deserves closer attention.
Conclusion
The USDC chart is deceptively simple. Most days, it is a flat line near $1.00. But that flatness is a feature, not a flaw—it reflects a functioning redemption mechanism and deep liquidity. The chart becomes genuinely informative during rare stress events, when wicks, volume, and market cap shifts reveal how much confidence the market has in the peg.
For traders, the USDC chart is a risk gauge. For businesses, it is a stability check before using USDC for payroll, vendor payments, or corporate card funding. Understanding the difference between normal noise and genuine depeg risk is the core skill, and it starts with watching the right metrics: price deviation, volume, market cap, and reserve transparency.